Election night 2026: how to follow the results
Where official results appear, what the words reported, projected and certified mean, and the closest Senate and governor races to watch.
What you will see on election night
This site does not report live vote counts. Counts come from each state’s election officials and from news organizations that tabulate them; we point you to the official sources below and show what forecasters and markets said before the vote.
Reported means the number the election office has published so far. Projected or called means a news organization judges that the trailing candidate can no longer catch up; it is a judgement, and organizations can make different calls. Certified means the state has completed its official canvass, which is the number that counts. Early numbers often shift as more ballots are counted, because ballots from different places and of different kinds are reported at different times.
Where to find official results
Every state publishes its own results. Vote.gov, the federal government’s voting portal, links to each state’s election office. After the states certify, the Federal Election Commission lists official federal election results, and the Clerk of the House publishes election statistics.
Exit polls and VoteCast
On election night you will see numbers from exit polls and from AP VoteCast, which are surveys of voters rather than counts of ballots. The National Election Pool, a group of news organizations that hires Edison Research, runs exit polls at polling places and by phone, and AP runs VoteCast with NORC. The results go to the news organizations that pay for them and are released after polls close. We do not republish them, because they are licensed to subscribers, and we do not present any survey as a result. Surveys have a margin of error and are weighted to the final vote count in the hours after polls close, so early versions can change.
Early voting numbers
Some states publish how many ballots have already been returned. See the official early voting counts and each state’s voting rules.
The closest races before the vote
These are the Senate and governor races that the median forecaster rates Lean or closer, with the price each market source showed at its last snapshot. Ratings and prices are estimates made before the election and are not results; the sources disagree in some races, and any of them can be wrong.
Results so far: U.S. Senate (unofficial)from Wikipedia's vote tables, not official
Results appear here when volunteers enter them into Wikipedia (JavaScript needed); the official numbers are on the state election sites linked from the section above.
Results so far: governors (unofficial)from Wikipedia's vote tables, not official
Results appear here when volunteers enter them into Wikipedia (JavaScript needed).
Results so far: U.S. House (unofficial)all districts with votes entered
Results appear here when volunteers enter them into Wikipedia (JavaScript needed).
Closest Senate and governor races22 races
| Race | Forecaster consensus | Polymarket | PredictIt | Kalshi | Manifold (play money) |
|---|---|---|---|---|---|
| Alaska Senate race | Toss-up | Mary Peltola 72% | D 65 / R 35 | D 70 / R 30 | D 69 / R 31 |
| Georgia governor's race | Toss-up | D 68 / R 32 | D 66 / R 33 | D 66 / R 34 | — |
| Iowa Senate race | Toss-up | D 44 / R 56 | D 44 / R 58 | D 45 / R 57 | D 44 / R 56 |
| Kansas Senate race | Toss-up | D 52 / R 48 | D 51 / R 50 | D 51 / R 50 | — |
| Maine Senate race | Toss-up | D 70 / R 30 | D 62 / R 39 | D 68 / R 34 | — |
| Nevada governor's race | Toss-up | D 78 / R 22 | D 79 / R 22 | D 75 / R 24 | — |
| Ohio Senate race | Toss-up | D 72 / R 28 | D 75 / R 28 | — | — |
| Texas Senate race | Toss-up | D 72 / R 28 | D 68 / R 34 | D 71 / R 30 | D 71 / R 29 |
| Alaska governor's race | Lean D | Jonathan Kreiss-Tomkins 87% | — | — | — |
| Florida governor's race | Lean R | D 36 / R 64 | D 31 / R 71 | D 35 / R 65 | — |
| Iowa governor's race | Lean D | D 86 / R 14 | D 87 / R 13 | D 85 / R 16 | — |
| Kansas governor's race | Lean R | D 28 / R 72 | D 29 / R 75 | D 27 / R 73 | — |
| Michigan Senate race | Lean D | D 80 / R 20 | D 70 / R 28 | D 77 / R 24 | D 78 / R 22 |
| Michigan governor's race | Lean D | D 94 / R 6 | D 93 / R 7 | D 93 / R 8 | — |
| Nebraska Senate race | Lean R | Pete Ricketts (R) 78% | D 1 / R 70 | D 0 / R 77 | — |
| New Hampshire Senate race | Lean D | D 93 / R 7 | D 91 / R 9 | D 92 / R 8 | — |
| Ohio governor's race | Lean D | D 82 / R 19 | D 86 / R 16 | D 80 / R 21 | — |
| Oregon governor's race | Lean D | D 82 / R 18 | — | D 81 / R 21 | — |
| South Carolina Senate race | Lean R | D 26 / R 72 | D 29 / R 72 | D 27 / R 72 | — |
| Texas governor's race | Lean R | D 36 / R 65 | D 34 / R 66 | D 35 / R 66 | — |
| Wisconsin governor's race | Lean D | D 84 / R 16 | D 84 / R 15 | D 83 / R 18 | — |
| Arizona governor's race | Lean D | D 92 / R 6 | D 84 / R 16 | D 91 / R 9 | — |
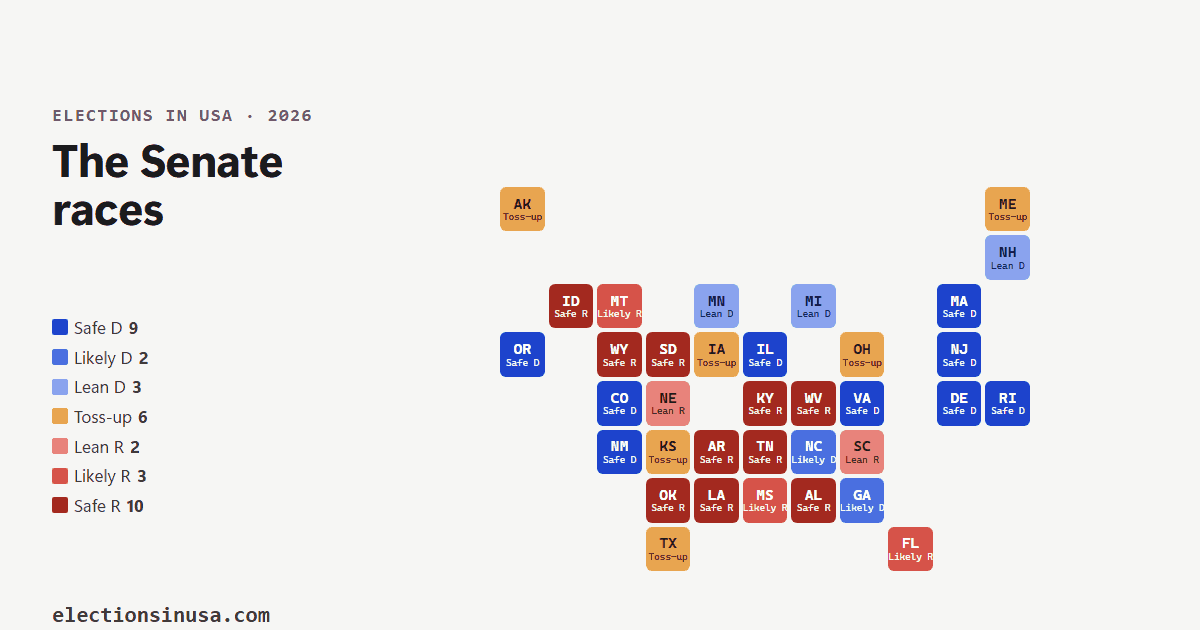
The Senate races at a glancecoloured by rating
Estimate One tile per Senate race on November 3, 2026, placed roughly where the state is. Colour is the median of the forecaster ratings listed on Wikipedia (CC BY-SA 4.0): 14 toward Democrats, 15 toward Republicans, 6 toss-ups. They are other people’s ratings, not ours. Hover or tap a tile for details, click to open the race. Download this map as an image.
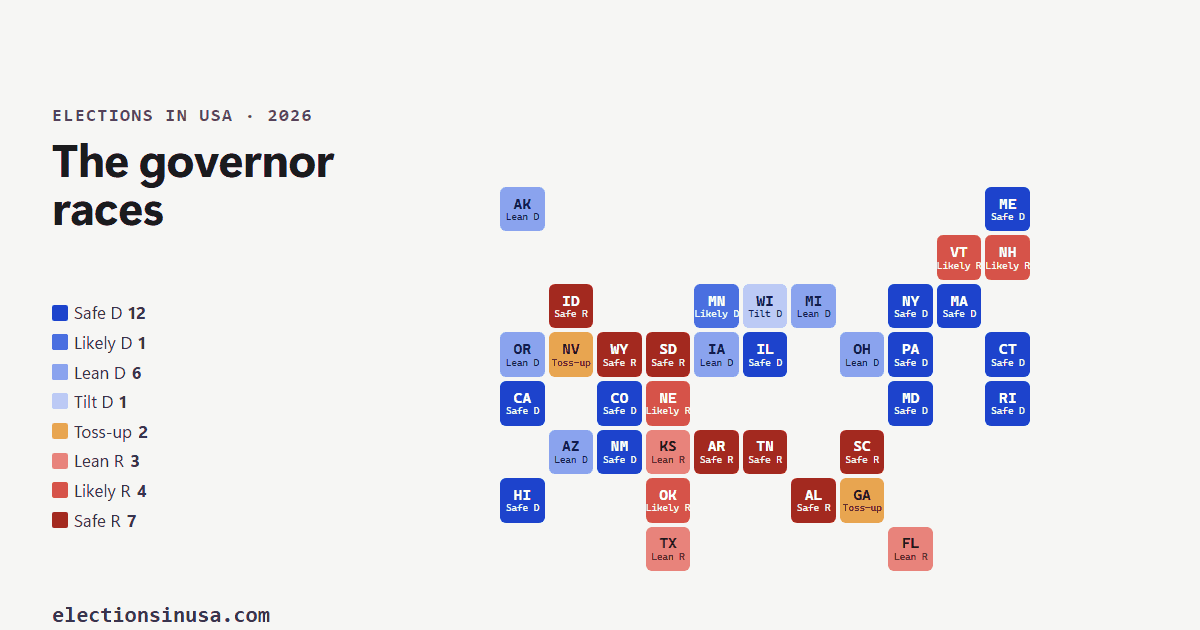
The governor races at a glancecoloured by rating
Estimate One tile per governor race on November 3, 2026, placed roughly where the state is. Colour is the median of the forecaster ratings listed on Wikipedia (CC BY-SA 4.0): 20 toward Democrats, 14 toward Republicans, 2 toss-ups. They are other people’s ratings, not ours. Hover or tap a tile for details, click to open the race. Download this map as an image.