The House battleground, all 435 races
One square per district, coloured by the median forecaster rating. Hover or tap for details, click to open a race.
Estimate Median of the ratings listed on Wikipedia (CC BY-SA 4.0) for each district, as of 2026-10-31; last results from the MIT Election Data and Science Lab (CC0). Download this map as an image.
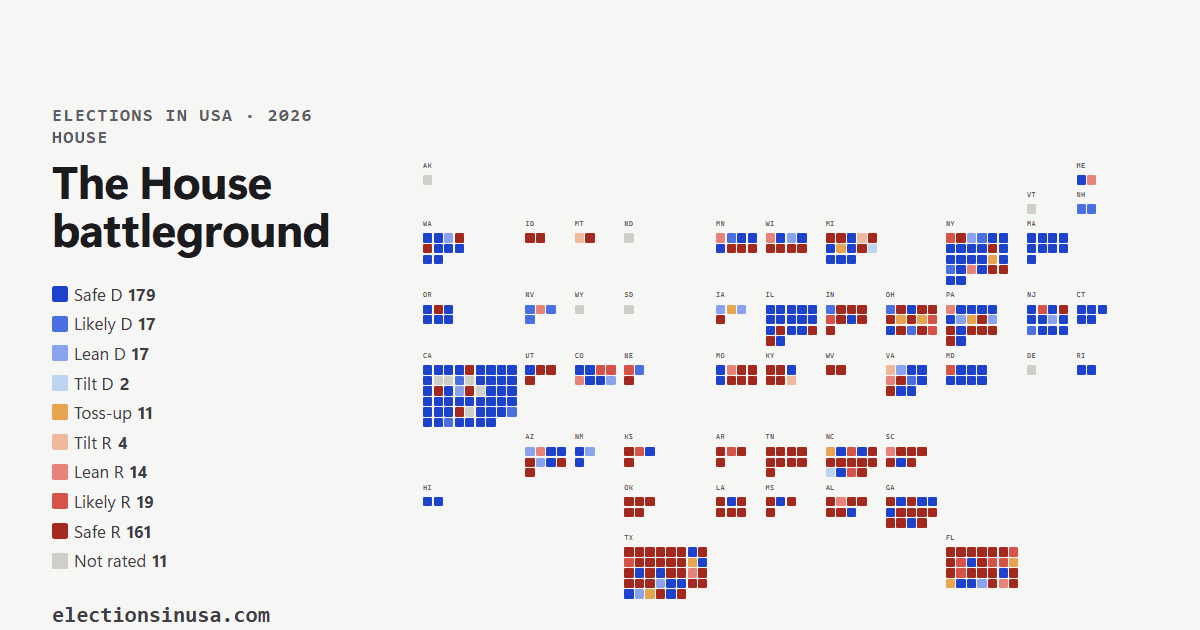
Each square is one of the 435 U.S. House districts, grouped by state and laid out roughly where the states are. The colour is the median of the ratings the forecasters we track have given the race (Safe, Likely, Lean, Tilt or Toss-up, towards either party). It is a summary of other people’s ratings, not our own. Districts no tracked forecaster has rated are grey. Hover over a square (or tap it on a phone) for the district, the incumbent, the last result and the money raised; click it to open the race. Counts differ from the leaning totals you may see elsewhere because forecasters define their categories differently: see how to read forecasts and where forecasters disagree.
Money raised against the 2024 resultevery district, one dot
Reported 415 districts with a 2024 result between two major parties and reported money; 20 left out (ranked-choice, unopposed, no money reported). Where a state drew a new map for 2026 the margin is for the old district. Money is total receipts of the candidates in the race (FEC); the colour is the median forecaster rating (Wikipedia, CC BY-SA 4.0). A dot shows what happened and what is reported, not what will happen.
The same numbers as a tablecounts by rating
| Median rating | Districts | Share |
|---|---|---|
| Safe D | 179 | 41% |
| Likely D | 17 | 4% |
| Lean D | 17 | 4% |
| Tilt D | 7 | 2% |
| Toss-up | 11 | 3% |
| Tilt R | 3 | 1% |
| Lean R | 15 | 3% |
| Likely R | 19 | 4% |
| Safe R | 156 | 36% |
| Not rated | 11 | 3% |